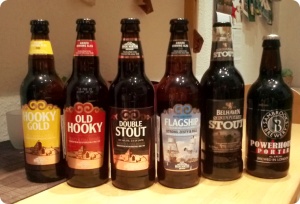
From time to time, having a beer is fun. Sometimes it’s even more fun if you can try different beers in a (more or less) controlled environment and rate them. Such a tasting is best enjoyed if it’s ‘blind’. Otherwise you may get easily diverted by fancy labels and beautiful custom bottles. Not to mention all the nonsense marketing blurb praising the ‘distinct, unique beer’, ‘brewed using only the very best ingredients’.
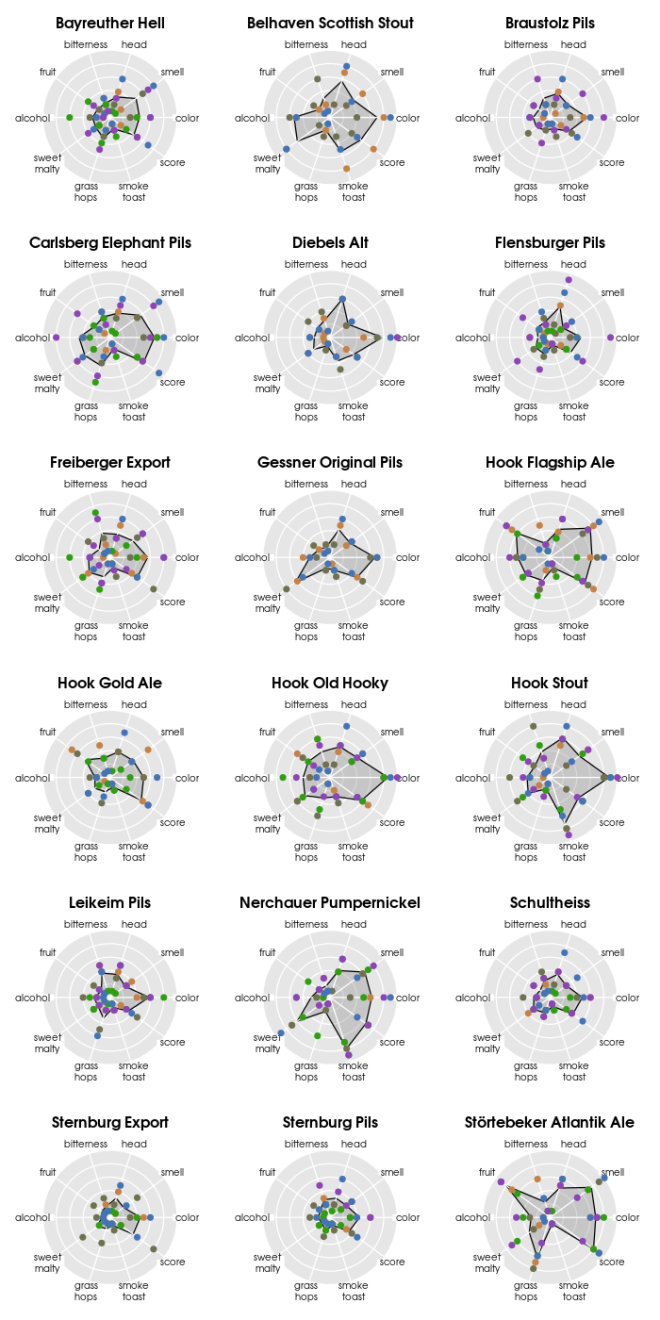
 Well, we (as a group of five) tried around 20 different beers and rated some basic qualities from color to head to taste. Among them were popular and not-so popular German beers as well as some UK bottles from a specialized shop. Then, I combined all the single scores of each beer in a ‘polar-coordinates’ plot. The grey area denotes the mean of the individual tester’s scores.
 None of us is a professional in describing flavours, but some results are nevertheless intriguing. All the common Pilsner beers (Braustolz, Flens, Schultheiss, Sternburg) obviously lack character, although they definitely have the biggest market share in Germany. The Ales perform better in terms of character, but that doesn’t mean I would drink a particular Ale all the time.
However, we found two notable exceptions to the standard German beers in our survey, the sweet and malty Nerchauer Pumpernickel and the American style Atlantik Ale. Both are coming from smaller-sized breweries, and they might be indicating a trend towards more powerful and courageous brews. Cheers!
The polar coordinates plots were created with R’s plotrix package and radial.plot().
library(plotrix)

# import data
dat <- read.csv("Tasting.csv")

# set up 10 radial positions & some colors
posit <- matrix(rep(seq(0, 324, 36)/180*pi, 5), nrow=5, byrow=TRUE)
colors <- c("#C58246","#6F7151","#2F9E11","#4473B6","#8D44B6")

# subsetting a beer
beer <- dat[dat$beer=="Hool Stout", ]
beer <- as.matrix(beer)
means <- apply(beer, 2, function(x) mean(x, na.rm=TRUE))

# polar coordinates plot
radial.plot(means, posit[1, ],
    rp.type="p", line.col=1, poly.col="#80808050",
    radial.lim=c(0, 10), labels=c("color","smell","head",
        "bitterness","fruit","alcohol","sweet\nmalty",
        "grass\nhops","smoke\ntoast","score"),
    grid.bg=grey(0.9), show.grid.labels=FALSE, grid.col="white"
)
radial.plot(beer, posit, rp.type="s", point.symbols=19,
    point.col=colors, radial.lim=c(0, 10), add=TRUE
)