It’s been a while, since I last wrote about a subject, and the one I’ll be writing about now is really inconvenient for most of us. But it matters.
It matters because most people have a job and earn money, but are not paid everything listed on their payroll. The reason for that is that your country or state collects taxes to finance the common infrastructure for its inhabitants. There are many different models for collecting taxes, many different ‘goods’ to tax, and even more ways to spend the collected money. In general, authorities collect three different major taxes:
- Income taxes. Directly subtracted from your wages.
- Corporate taxes. A certain percentage of a company’s net profit.
- Value added tax. A tax on sold products. Affects both companies and individuals and depends on the turn-over of goods.
There are many more specific taxes or different ‘flavors’ of the same tax. Here, I visualized the rates of the three major taxes (as listed on wikipedia) using R and the spplot package. I ended up with the following maps. Note that the color key counter-intuitively shows high taxes in blue and low taxes in alarming red, because we want to identify the villainous countries with extraordinary low tax rates.
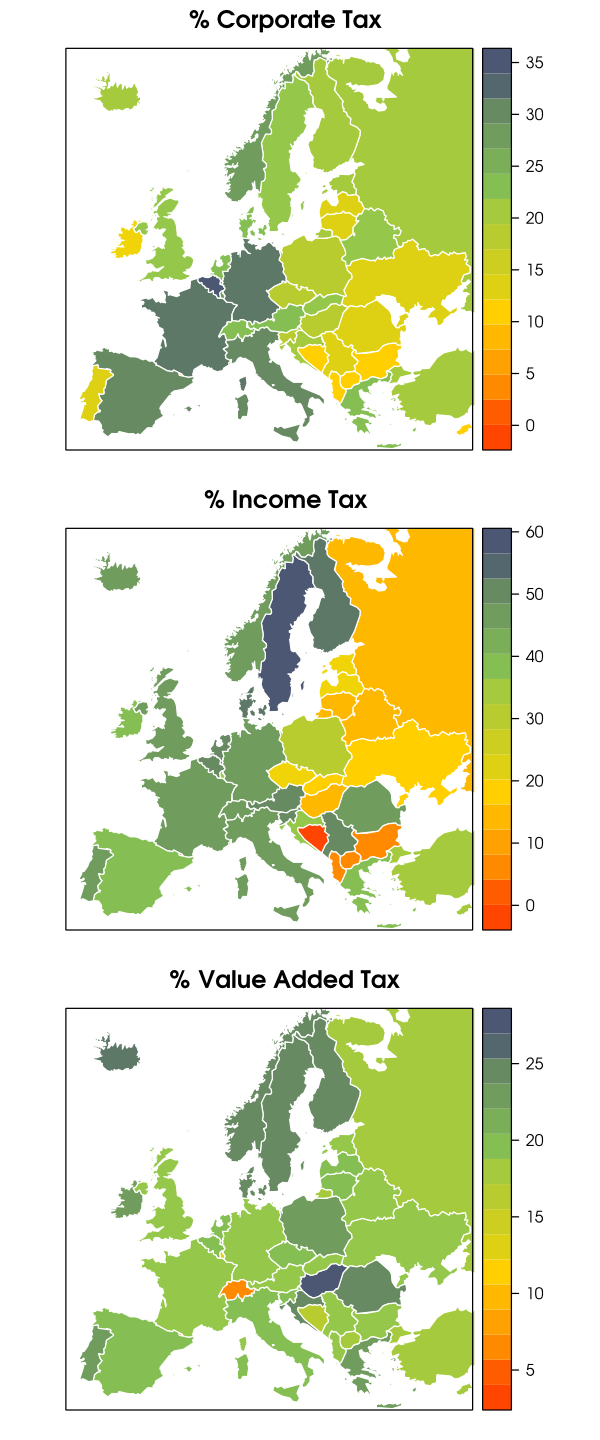 Obviously, Western European countries have similar tax rates and we cannot readily identify tax haven countries. There are some exceptions, though, like the low corporate tax in Portugal and Ireland or low VAT rates in Switzerland. Is this it? Don’t we have more interesting tax refuges to offer in Europe? The answer is not visible in those maps, because size matters.
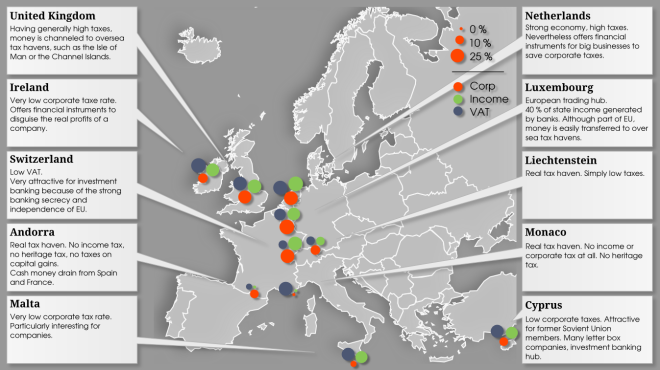
First, why are low taxes a problem at all? Because, every individual or company who can afford will try to evade tax paying as best as it can. What seems just natural to save money and gain a competitive advantage, is in reality a major burden to our society. Globalized trading and electronic cash flow made it easy to shift huge amounts of money from high tax countries to tax havens—most often tiny states without notable industry or resources. The bottom line is that the high tax country provides all the infrastructure for running a company, while only the tax haven benefits from the company’s profits at no own expenses. And here’s a proper list of European’s tax havens.
 Sources: wikipedia.org, Deutsche Welle report on tax havens.
# download world shapefile from http://aprsworld.net/gisdata/world/
# import europe map
europe <- readShapeSpatial(fn="europe.simple", IDvar="SP_ID")
# import data
tax <- read.csv("taxes.csv"); tax$Country <- toupper(tax$Country)

# merge data.frames
europe@data <- merge(europe@data, tax, by.x="NAME", by.y="Country", all=TRUE, sort=FALSE)
europe@data <- europe@data[order(as.numeric(as.character(europe@data$SP_ID))), ]

# plot the map
cols <- colorRampPalette(c("#FF4500", "#FFD700", "#89C755", "#4D5773"))(20)
spplot(europe, 9:11,
   xlim=c(2.5e+06, 6.5e+06), ylim=c(1.45e+06, 5.4e+06),
   col.regions=cols,
   as.table=TRUE, col="white", strip=FALSE
)